Summary
- Recently NextEra Energy surpassed Exxon Mobil in marketcap becoming the largest energy company in the United States.
- NEE trades a a substantial premium to its metrics especially revenue and total equity while XOM trades at a 28% discount equity.
- NextEra has much more growth potential than Exxon over the long-term as renewables should see significant growth through 2050 compared to natural gas and oil.
2020 has been full of surprises and recently NextEra Energy Inc. (NEE) passed Exxon Mobil Corporation (XOM) as the most valuable energy company by market cap in the United States. At the close of the market on 10/13/20 XOM finished the day at $34.23 with a market cap of $146.42 billion and NEE trades at $301.47 with a market cap of $149.67 billion. There is no question that over the past five years NEE has been a more lucrative investment. Over a five-year period NEE has returned 201.30% while XOM has lost 56.33%. In just the past year NEE has climbed 33.17% while XOM declined 49.8%. For the readers who are thinking what about XOM’s dividend the answer may be shocking. If you had invested $10,000 on 10/13/15 in both XOM and NEE over the past five years your position in XOM would have generated a -45.37% return with a value of $5,464.05 while your investment in NEE would have appreciated to $34,423.32 resulting in a 244.21% return. If you read my articles its well know that I feel energy companies are undervalued but the proof is in the numbers. As far as market cap and return on investment NEE is the clear winner but is it really the king of energy or has its share price appreciated to quickly? I am going to examine both companies to determine who in my opinion is really the king of energy and where I would invest new capital today.
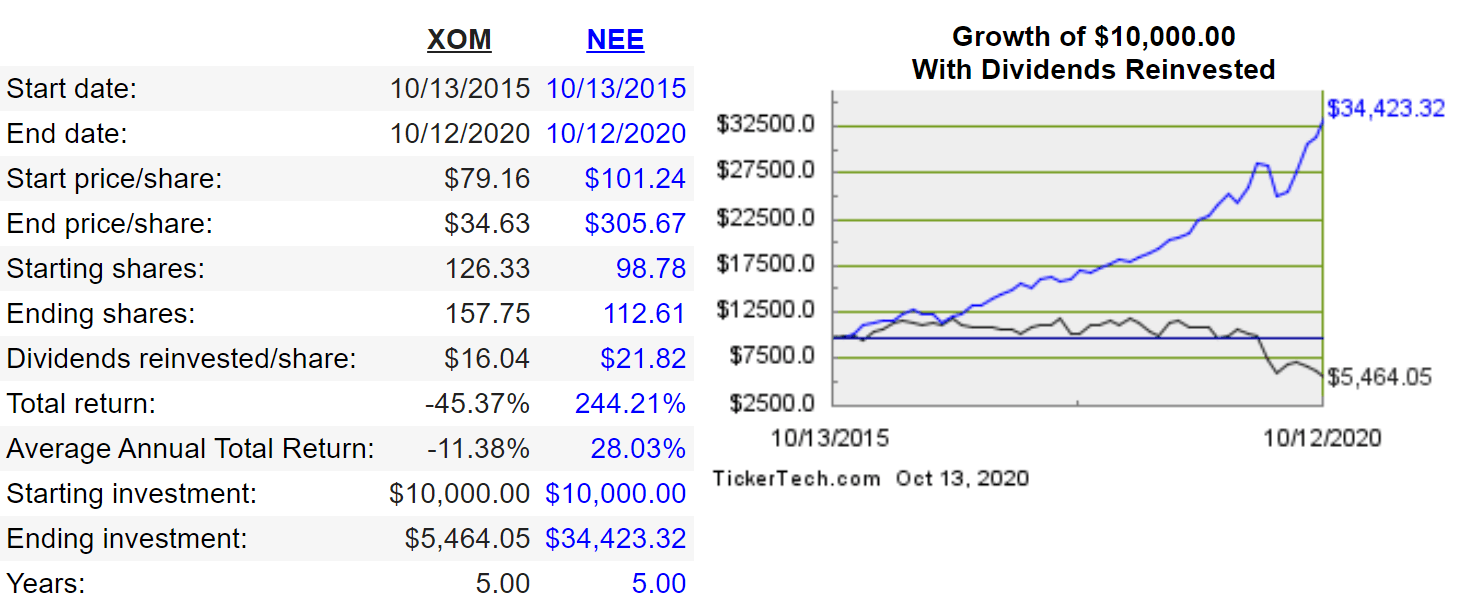
(Source: Dividend Channel)
Exxon Mobil Vs. NextEra by the numbers
I am going to discuss two sets of numbers between XOM and NEE. I will examine both companies based on the 2019 full year and the first six months of 2020. Starting with the latest full year results from 2019 NEE generated $19.20 billion in revenue, their operating expenses came in at $13.85 billion, operating income was $5.35 billion and net income was $3.39 billion. NEE finished 2019 with $7.41 billion in total current assets, $600 million cash on the books and $117.7 billion in total assets. NEE’s total liabilities totaled $76.33 billion and the total equity in the company was $41.36 billion.
In 2019 XOM generated $264.94 billion in revenue while their operating expenses totaled $244.88 billion. XOM’s operating income was $20.06 billion while their net income totaled $14.77 billion. XOM had $50.05 billion of total current assets on the books with $3.09 billion in cash on hand. Their total assets amounted to $362.6 billion while their total liabilities equaled $163.7 billion. At the end of 2019 there was $198.94 billion of total equity in XOM.
By the numbers at the end of 2019 XOM was a much bigger company than NEE. XOM generated an additional $245.73 billion in revenue which is a difference of 1,280%, produced an additional $11.39 billion in net income. XOM’s assets and equity was also much larger than NEE’s as XOM had an additional $244.91 billion in assets while having an additional $157.58 billion in total equity.

