Summary
- SRE has completed the divestiture of its South American businesses to narrow focus on its North American businesses.
- The disposal should enhance SRE's net margins, on aggregate.
- SRE is one of the best energy infrastructure companies in North America that pursues regional business growth opportunities and is capable of increasing its dividends, together with share price appreciation.
- Towering debt and the role of California regulators are the major challenges for the long outlook, while the recent surge in COVID-19 cases acts as a near-term headwind.
- SRE still trades at ~10% below its 200-day SMA which implies that the share price trajectory should gradually build up, given the company's strong fundamentals.
Thesis
Sempra Energy's (SRE) share price nose-dived following the 'mid-March' steep decline in the S&P 500 (SPY) and the Dow Jones Utilities Average Index (DJU). These indices are also SRE's benchmark indices. However, things looked fine when SRE subsequently reported its Q1 results in May. Q1 EPS outperformed the estimate despite a slow economic cycle that supposedly hit demand during the quarter (Q2 results aren't out yet). SRE has been assigned a suitable Quant Rating on multiple Factor Grades that promote its fundamental strength. However, as COVID-19 cases increase during Q2 and Q3 of FY 2020, the situation is presenting certain red flags for the share price, at least for the near term.
I believe SRE's recent divestiture of its South American businesses is a strategic milestone that'd help it better focus on its North American businesses. The company's balance sheet is high on debt that does not pose a real threat and is manageable. Similarly, the regulatory risk in California is another concern. Long term, the odds are in favor of the company, and SRE is set to continue its dividend growth story together with suitable share price appreciation.

Figure-1 (Source: Fortune)
Technical Picture
Being an S&P 500 constituent, SRE's past 6 months' price returns have largely underperformed the returns of its benchmark indices (Figure-2). Nevertheless, SRE's technical picture does indicate suitable upside since the current prices are still ~10% lower (Figure-3) compared with its 200-day SMA (read: Simple Moving Average).
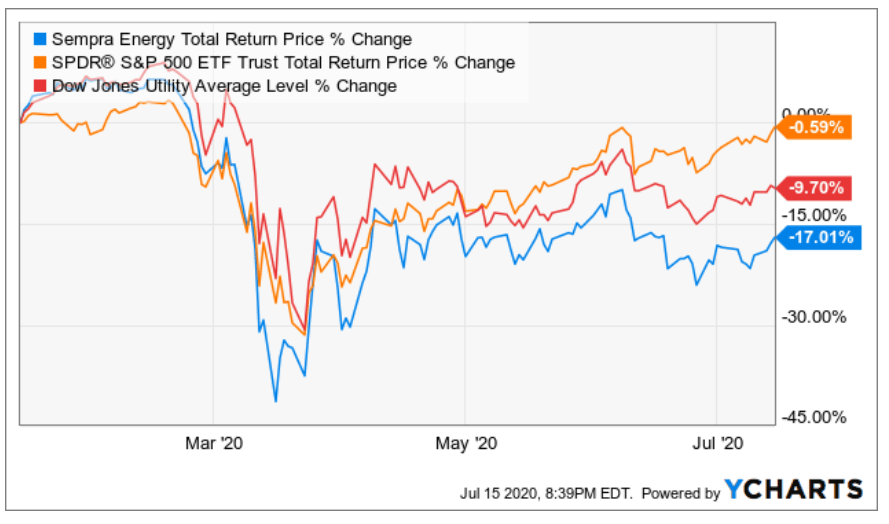
Figure-2 (Source: SA Premium)
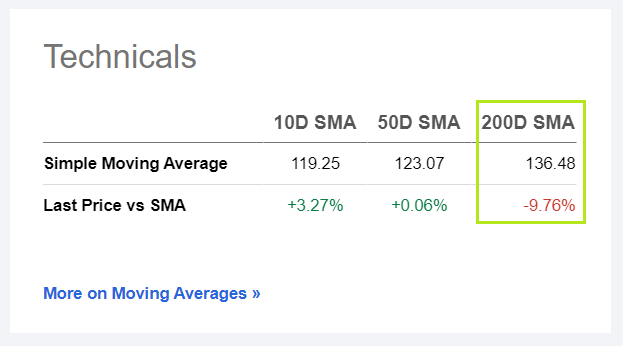
Figure-3 (Source: SA Premium)
In fact, the actual technical price chart (Figure-4) is quite interesting. It shows a mix of two major trends; a diverging pattern for a shorter horizon that began since mid-April and a converging pattern for a relatively longer horizon that began since mid-February. The merger of these two trends indicates that SRE's share price could vary between the current consolidation range (~$115-130). However, any breakout above the $130 mark would up the near-term target price to ~$140. Then again, any technical analysis won't make much sense without considering SRE's fundamentals. So, let's take a detailed look at its fundamental picture.

